
Survey Analysis Plan
Vision & Eye Health Surveillance System
LAST UPDATED:
MAY 1, 2018
PRESENTED TO:
Jinan Saaddine,
Division of Diabetes
Translation,
Centers for Disease
Control and Prevention
PRESENTED BY:
John Wittenborn,
Clare Davidson,
David Rein,
NORC at the University of Chicago

NORC | Survey Analysis Plan: Vision & Eye Health Surveillance System
I
Table of Contents
Introduction ................................................................................................................................. 1
The Vision and Eye Health Surveillance System (VEHSS) .................................................. 1
Overview of the Integration of National Surveys in VEHSS .................................................. 1
Draft Analysis Plan Outline ........................................................................................................ 3
Step 1: Survey Validation and Dataset Preparation ............................................................. 3
Step 2: Define Outcome and Stratification Variables ............................................................ 3
Step 3: Estimate Results ...................................................................................................... 5
Step 4: Dataset preparation .................................................................................................. 6
Disseminating Results and Statistics ....................................................................................... 8
Data Reports ......................................................................................................................... 8
Appendix A. Categorization Schema for National Survey Variables ................................... 10
Survey Questions for Analysis ............................................................................................ 12
Appendix B. VEHSS Uniform Data Table Template ............................................................... 17
Appendix C. VEHSS Uniform Data Template: Survey Stratification Factors Data
Dictionary .................................................................................................................................. 19
Appendix D. Default Prevalence Estimates Stratifications for Survey Data ....................... 22

NORC | Survey Analysis Plan: Vision & Eye Health Surveillance System
II
List of Tables
Table 1. Example Data Dictionary Table .................................................................... 8
Table 2. Example Summary Outcome Table ............................................................. 9
Table 3. Overview of Surveys and TOPICS ............................................................. 11
Table 4. Survey questions included in analysis ........................................................ 12
Table 5. VEHSS Uniform Data Table Template ....................................................... 17
Table 6. PUF Ages ................................................................................................... 19
Table 7. Race/Ethnicity Categories .......................................................................... 19
Table 8. Gender Categories ..................................................................................... 19
Table 9. Risk Factors ............................................................................................... 20
Table 10. Locations .................................................................................................... 20
Table 11. Insurance (RDF only) ................................................................................. 21
DISCLAIMER: The findings and conclusions in this report are those of the authors and do not necessarily
represent the official position of NORC at the University of Chicago or the Centers for Disease Control
and Prevention.

NORC | Survey Analysis Plan: Vision & Eye Health Surveillance System
1
Introduction
The Vision and Eye Health Surveillance System (VEHSS)
The Centers for Disease Control and Prevention (CDC) issued a cooperative agreement with NORC at the
University of Chicago (NORC) to establish a national Vision and Eye Health Surveillance System
(VEHSS). NORC has partnered with leading organizations in vision care and research, and an expert
panel provides oversight and review of VEHSS results and work products.
This document serves as a data analysis guide for survey data used by VEHSS analysts and data providers
and may be updated throughout the course of the project.
Overview of the Integration of National Surveys in VEHSS
National surveys play an important role in VEHSS. The five-step process described below provides an
overview of VEHSS’ approach to compile and leverage vision and eye health data across multiple
national surveys. The goal is to present those data to the public and use them to estimate national
prevalence and service utilization rates.
■ Project Step 1. Identify sources of vision and eye health related survey data
In the project’s first step, we identified and reviewed different potential data sources,
including national surveys. We identified 16 national surveys with vision and eye health
related instruments.
■ Project Step 2. Summarize characteristics of the survey methodology and instruments
In the next step, we compiled the key methodological features and eye and vision related
questions and measures in each survey. These were summarized and reported in VEHSS’
“Review of National Survey Data on Eye Health Report.”
■ Project Step 3. Identify and define categories to organize and present outcomes from
multiple surveys in a comparable manner
We created a 2-level categorization schema (categories and subgroups) for all survey
questions from the 16 identified surveys. Based on survey methodology, sampling frame and
included instruments, we recommended including the following six surveys:
1. American Community Survey (ACS)
2. Behavioral Risk Factors Surveillance System (BRFSS)
3. Medicare Current Beneficiary Survey (MCBS)
4. National Health Interview Survey (NHIS)
5. National Health and Nutrition Examination Survey (NHANES)

NORC | Survey Analysis Plan: Vision & Eye Health Surveillance System
2
6. National Survey of Children’s Health (NSCH)
We also recommended including and excluding specific survey questions among these 6
surveys. The questions listed in Appendix A are based on these recommendations as well as
comments received from the VEHSS expert panel.
■ Project Step 4. Analyze individual surveys to populate the outcome categories with
single-source estimates
VEHSS analyzed the selected surveys to generate single-source estimates for the categorized
data indicators. The term ‘single source’ refers to estimates derived from a single data source.
The single source estimation step results in public use files (PUFs) which contain high-level
summary results for each individual dataset. The analysis and results of each survey are
documented in separate data analysis reports, and the PUFs are available through the VEHSS
data visualization application and the CDC Open Data platform. The research team also
created research de-identified files (RDF) for datasets that are used internal to the project for
further analysis.
■ Project Step 5. Select individual surveys for inclusion in the statistical integration models to
generate the comprehensive national estimates
In the final VEHSS project step, we build on the single-source estimates by further
harmonizing multiple data sources including surveys, claims, registry, and population-bases
study estimates. This process uses statistical meta-regression models to summarize estimates
derived from the RDFs from multiple sources, and to create sociodemographic group
specific, national and state level prevalence and service utilization rate estimates for selected
vision and eye health data indicators.
This report presents the project plan for utilizing the national surveys to create single-source estimates in
Step 4 above. An overview of the approach to analysis and dissemination is provided. The appendices
contain supporting documentation to further explain how variables are categorized and analyzed.

NORC | Survey Analysis Plan: Vision & Eye Health Surveillance System
3
Analysis Plan Outline
This section presents VEHSS’ overall analysis plan which uses the survey question categories, analysis
factor variables, and output data format included in Appendices A-D.
Step 1: Survey Validation and Dataset Preparation
The initial approach to dataset preparation included the following steps:
Review identified variables
Based on publicly available survey documentation, we identified vision and eye health related questions
for each survey, as described in the “Review of National Survey Data on Eye Health Report.” In some
cases, survey documentation was incomplete.
Analysts locate outcome and stratification variables in the data files and confirm the accuracy and
completeness of the survey and survey instrument information in the survey identification report.
Select years of data for analysis
We evaluate survey variable availability by year, sample size and response frequencies to determine
which years of each dataset to analyze, and whether multiple years must be merged to increase the sample
size.
Survey structure, weighting, and denominators
Analysts further review the survey documentation to identify any relevant information such as missing
value coding, skip patterns, and survey weighting. The proper denominator is defined for each survey
instrument.
Internal consistency of questions
Analysts check questions for consistency in measurement and language both within and across surveys.
Checks within surveys included checking skip patterns and the level of contradictory responses among
two or more similar questions. Major internal consistency issues are described in the Survey data analysis
reports for each data source.
Step 2: Define Outcome and Stratification Variables
The next step in survey data analysis is to define the outcome, risk factor, and other stratification
variables. Outcome measures are determined based on the survey question response options, which are
mapped to response options defined by the VEHSS project as part of the categorization schema described
in Appendix A. Over time, survey outcome measures may change due to changes in survey questions, or

NORC | Survey Analysis Plan: Vision & Eye Health Surveillance System
4
changes to the VEHSS categorization schema. Outcome measures, stratification variables, and response
values are modeled after the VEHSS Uniform Dataset Template in Appendix B.
Define variable types and responses
Analysts determined if outcome variables and risk factor variables are bivariate or scaled response.
Scaled responses:
We include some scaled response variables as part of the single-source estimates. Scaled responses are
analyzed as proportions, such that all possible responses sum to 100%. Scaled responses therefore include
response values for survey responses such as I don’t know, Missing, Refused, etc.
Bivariate responses:
Bivariate responses are defined as questions with responses primarily consisting of Yes or No. Responses
may also include Refused, Missing, or other responses indicating that the question was not answered.
The VEHSS team considered different options for coding responses for such questions. Currently, only
Yes responses are coded. The denominator of this response includes all respondents who provided a Yes
or No response. Other responses such as Refused or I don’t know were dropped from the denominator.
This approach is based on CDC guidance, and follows their standard practice for reporting proportions
from surveys.
The VEHSS Uniform Dataset Template
The VEHSS Uniform Dataset Template is a standardized data format and data dictionary that ensures that
all data is organized and reported in a consistent manner to support the CDC data visualization
application, the CDC Open Data platform, and the DisMOD-MR statistical integration model. Variable
templates are summarized below, and included in detail in Appendix B.
Race and Sex:
As defined in the VEHSS uniform data template, survey respondents were assigned to mutually exclusive
race/ethnicity and gender categories (Note: the term “gender” is used herein to align with the terminology
used by the CDC data visualization system). If a particular survey did not include all race/ethnicities, this
was noted in the data brief and documentation for that survey.
Age groups:
All surveys were analyzed using:
■ Overall total (all ages)
■ Major Age Groups (0-17, 18-39, 40-64, 65-84, 85+)

NORC | Survey Analysis Plan: Vision & Eye Health Surveillance System
5
Survey files included in the statistical integration model use the VEHSS/World Health Organization
(WHO) expanded age groups as noted below (0-1, 1-4, 5-9, 10-14, etc.).
Risk Factors:
The risk factors currently included in the VEHSS survey analyses are diabetes, hypertension, and
smoking. Each risk factor is analyzed independently of the others. Risk factors responses are defined in
the VEHSS Uniform Data Template.
As with eye and vision indicators, risk factor responses may be bivariate or scaled. Bivariate responses
were calculated for Yes, No, Refused/Don’t Know, and Total. Proportions for each level of scaled
responses were calculated and sum to a 100% of total responses. Respondents with missing risk factor
responses were included in the overall analysis.
Analysts coded some risk factors as bivariate to avoid high suppression rates. For example, Smoking was
collapsed into a bivariate response (yes-including current and former, and no-including never) for
NHANES to avoid near universal suppression.
Insurance:
Insurance status was included for integration into RDF results only. Missing insurance was noted, and
respondents with missing insurance responses were included in the overall analysis.
States:
If available, survey results were analyzed by state. Missing states were noted, and respondents with
missing state responses were included in the overall analysis.
Step 3: Estimate Results
Each dataset was analyzed based on the years selected for inclusion.
Data Values
The primary data value is a proportion and reported using a percentage format. For bivariate responses,
this corresponds to the prevalence rate of Yes responses. For scaled responses, the data value is a
proportion of respondents for each scale response value, and all responses sum to 100%.

NORC | Survey Analysis Plan: Vision & Eye Health Surveillance System
6
Statistical measures
Based on the recommended standard for calculating small confidence intervals for proportions from the
NCHS, upper and lower confidence intervals and the relative standard error (RSE) were calculated using
the Clopper-Pearson (exact) method.
*
The respondent sample size are reported for each response.
Age adjustment
The data visualization application allows display of different data types, including ‘crude prevalence’ and
‘age adjusted prevalence’. When included, age adjusted results may use alternative methods for
calculating confidence intervals because of statistical software limitations.
Step 4: Dataset preparation
Summary Table Public Use Files (PUF)
In addition to creating single-source estimates for the VEHSS data visualization application, we also
created summary table PUFs. PUFs do not contain any patient-level records. PUFs are de-identified,
summary data tables which contain prevalence rates, scaled responses, utilization rates, and sample sizes.
The data are summarized across multiple patients and grouped by the different stratification factors
described in Appendix C. All survey, claims, and registry data are formatted into a PUF based on the
VEHSS uniform data template to create individual datasets using the same data structure and a common
set of data identifiers.
The age groups, suppression, and dissemination rules for PUFS are described below:
Age Groups:
Age groups are as follows: 0-17, 18-39, 40-64, 65-84, 85+.
Suppression:
The data suppression rules are:
■ Suppress rate only if RSE >30%
Footnote: “**Some values are suppressed due to a relative standard error >30%”
■ Suppress rate and sample size if sample size < 30
Footnote: “*Some values are suppressed due to a sample size <30”
■ Suppress rate and sample size if both
*
Parker JD, Talih M, Malec DJ, et al. National Center for Health Statistics Data Presentation Standards for Proportions. National
Center for Health Statistics. Vital Health Stat 2(175). 2017

NORC | Survey Analysis Plan: Vision & Eye Health Surveillance System
7
Footnote: “***Some values are suppressed due to a sample size<30 and a relative standard
error >30%”
Suppressed rows remain in the PUF, with footnotes indicating the reason for suppression. This
suppression algorithm was developed based in part on a review of common suppression algorithms for
health data from sample survey results and population count systems in use by Healthy People 2010, as
well as current CDC Vision Health Initiative (VHI) practice.
†
Dissemination:
PUFs are loaded onto the CDC Open Data platform or housed on a separate secure server. If a data
provider does not want the actual PUF to be accessible to the public, the PUF can be housed on a separate
secure server. The data visualization application can still query the data, but only do so for one data point
at a time. This effectively prevents users from obtaining or recreating the full dataset. Currently, all
survey PUFs are loaded onto the CDC Open Data Platform.
Stratifications:
Because the data visualization application displays lines of data, but does not perform calculations, every
possible combination of stratification variables that is displayed in the data visualization application was
previously specified in the PUF table. For each state/national level, there are 24 potential combinations of
stratification factors as detailed in Appendix D. Stratification factors include:
■ Age (age group)
■ Race (race/ethnicity)
■ Gender
■ Risk Factor, and
■ State/national location
Not all combinations are included in the PUF data. The drop-down menu options in the data visualization
application are data driven. If a combination of factors is not in the PUF, then users are not given this
option. Stratification level decisions for each dataset are made on a case by case basis. Where possible,
we include all stratifications unless it results in exceptionally high missing or suppressed rates. Specifics
are provided in the individual survey data reports. For example, in the ACS we included all state level
stratifications. In contrast, for NSCH, we included all stratification levels for national results only. For
state level NSCH results, we found that >90% of the results were missing/suppressed, and therefore, we
decided to only include single-level stratification at the state level.
†
Klein RJ, Proctor SE, Boudreault MA, Turczyn KM. Healthy People 2010 criteria for data suppression. Statistical Notes, no 24.
Hyattsville, Maryland: National Center for Health Statistics. June 2002. Available at:
https://www.cdc.gov/nchs/data/statnt/statnt24.pdf

NORC | Survey Analysis Plan: Vision & Eye Health Surveillance System
8
Disseminating Results and Statistics
Data Reports
Preliminary results and statistics from each PUF dataset are compiled into summary data reports, with
tables and figures depicting results for each outcome by each available stratification factor (age group,
race/ethnicity, gender, risk factor, state) . Reports include the elements described below.
Dataset description
We provide a description of the survey, including:
■ Purpose and Scope
■ Sample Design
■ Data Collection Procedures
Analysis Process
We document the analysis procedures, including any issues encountered during analysis. For example, we
describe issues with missing data or issues with data quality for internal consistency.
■ Analysis Overview
■ Analysis Variables
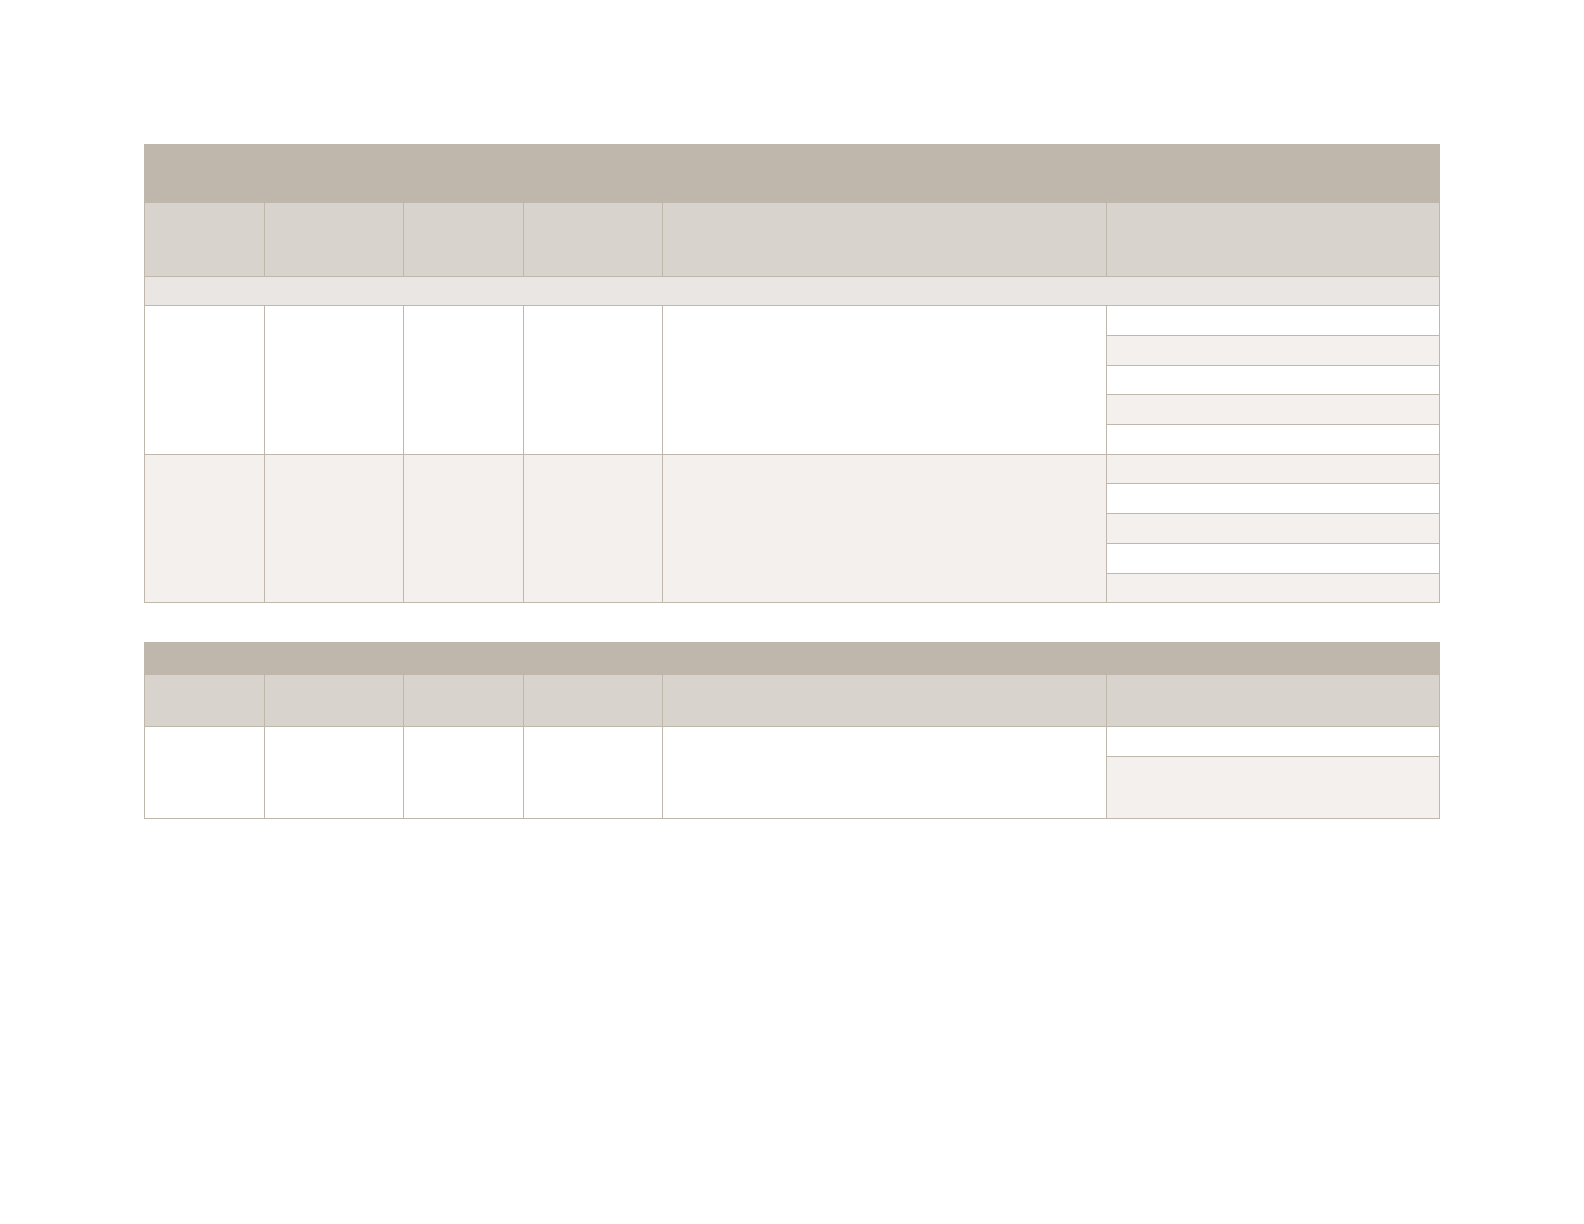
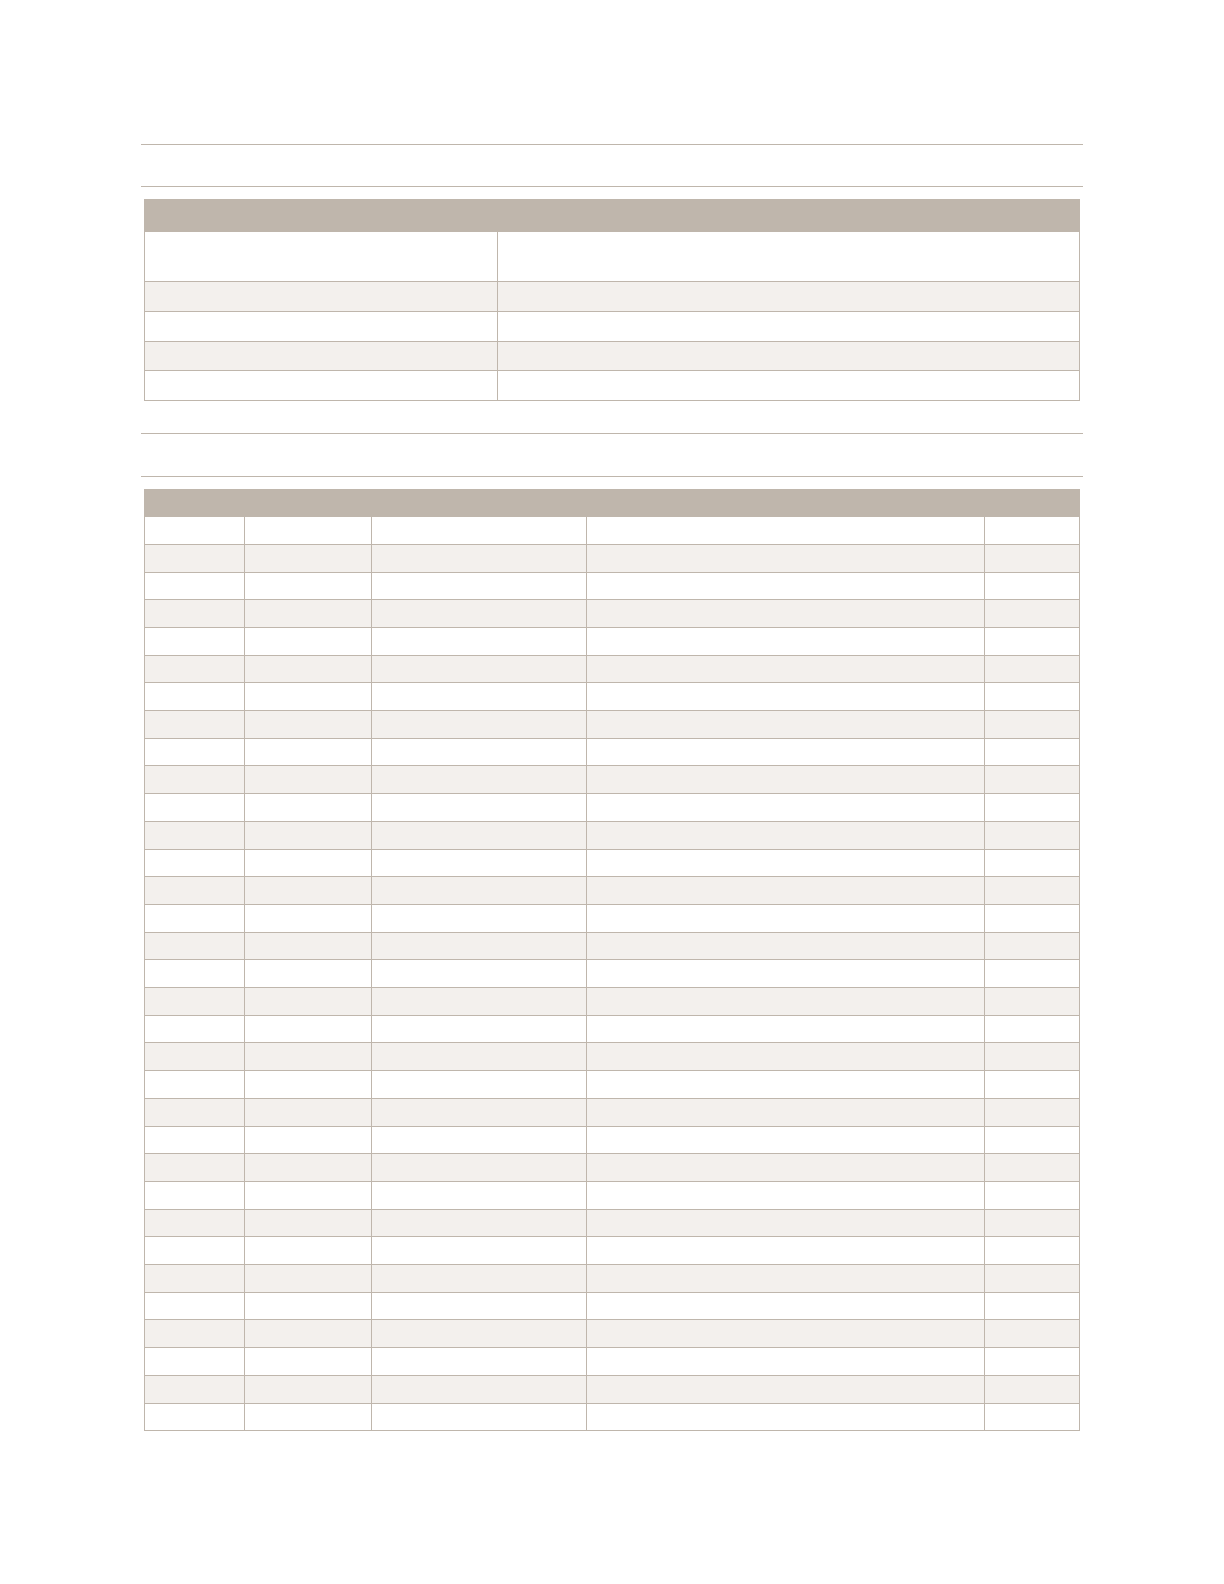
Data Dictionary and Classification to VEHSS Indicators
We outline the variables reported in the analysis based on the VEHSS Uniform dataset template.
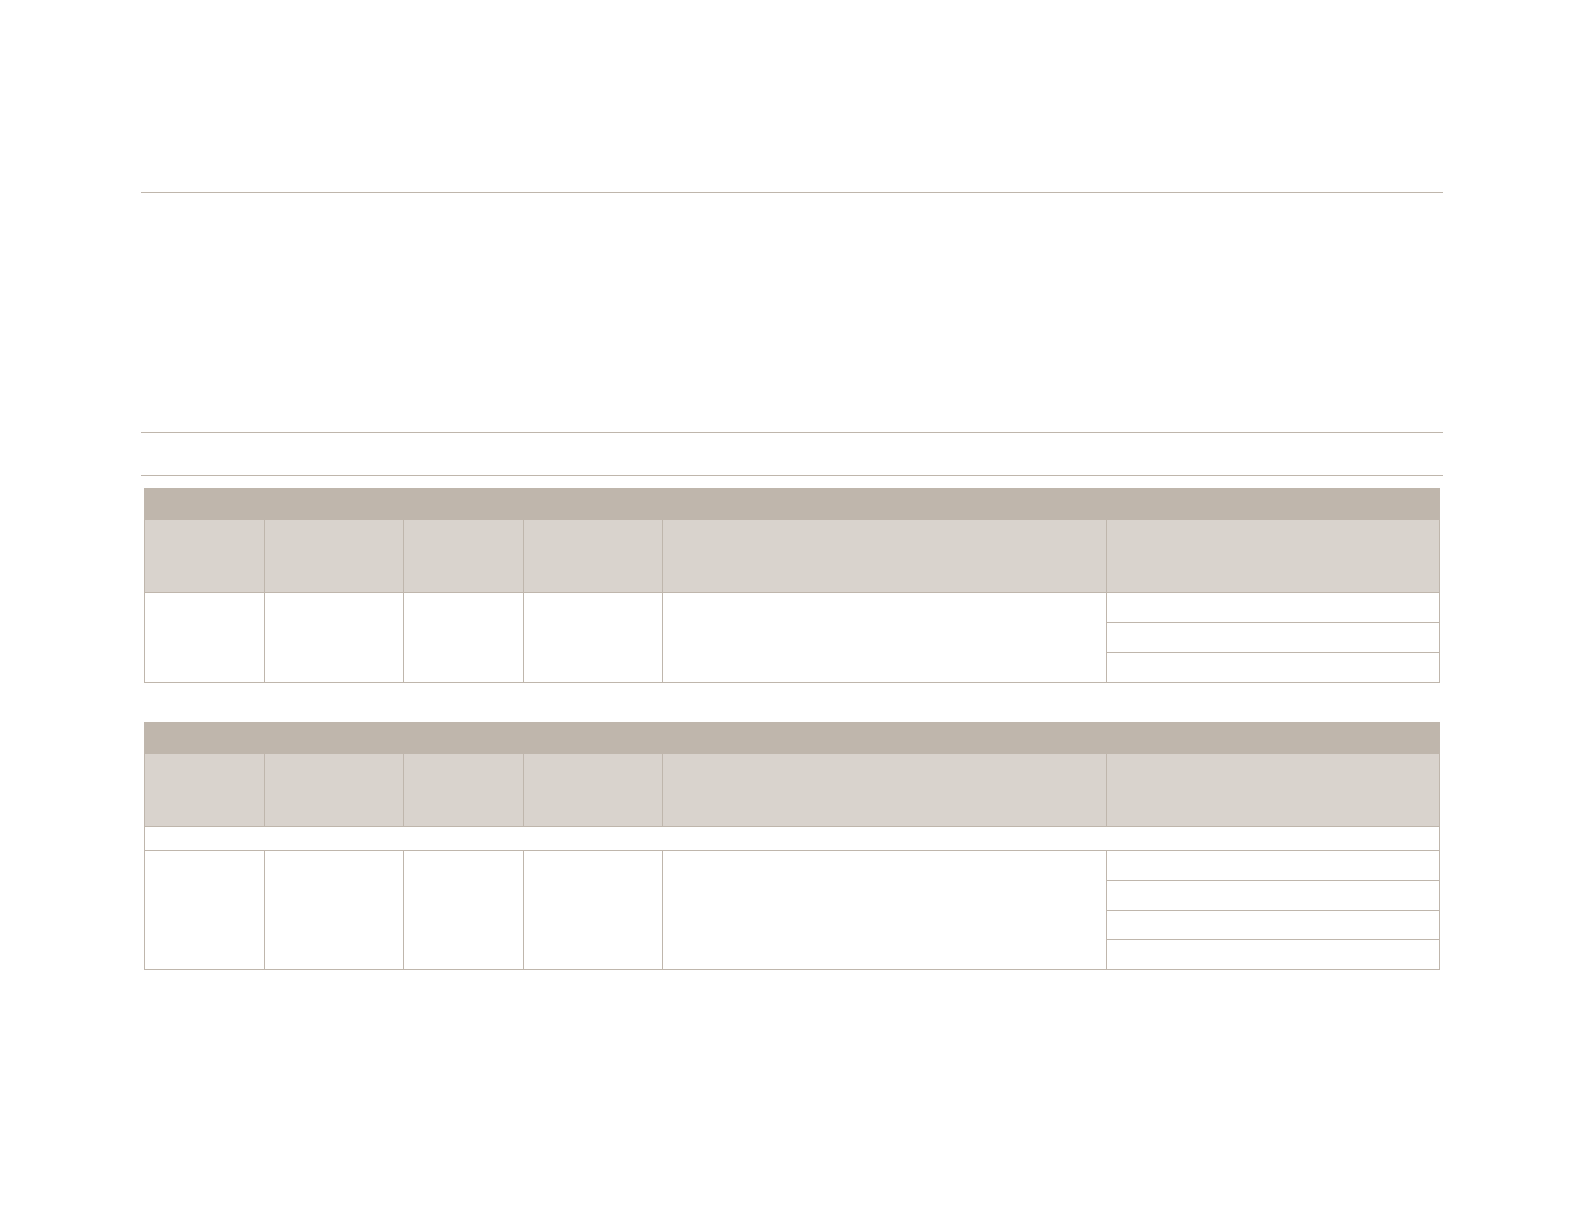
Table 1. Example Data Dictionary Table
NSCH
VEHSS
Indicator
Topic
VEHSS
Indicator
Category
NSCH
Variable
Name
Years
Available Question Response Options
Visual
Function
Difficulty
Seeing with
Glasses
K2Q44A
2007,
2011/2012
Has a doctor or other health care
provider ever told you that
[CHILD] had vision problems that
cannot be corrected with glasses
or contact lenses?
1 Yes
2 No
Visual
Function
Vision
Impairment
K2Q44C
2007,
2011/2012
Would you describe [his/her]
vision problems as mild,
moderate, or severe?
1 Mild
2 Moderate
3 Severe
4 Don’t Know
5 Refused

NORC | Survey Analysis Plan: Vision & Eye Health Surveillance System
9
Validation Results
We provide a review and description of the survey sample sizes, number of cells suppressed, initial data
quality checks, and other validation steps.
Summary Outcome measures:
Data tables are created to include the rate, 95% confidence interval of the rate, and the sample size for
each indicator. Indicators are reported by single level stratifications (*when available) by:
■ Age group
■ Race/ethnicity
■ Gender
■ Risk factor*
■ State*
■ Insurance*
Table 2. Example Summary Outcome Table
Gender Prevalence Rate Sample Size
Male
1.9 (1.6-2.2) 49,163
Female
1.6 (1.3-1.8) 46,292

NORC | Survey Analysis Plan: Vision & Eye Health Surveillance System
10
Appendix A. Categorization Schema for National Survey
Variables
The proposed 2-level categorization schema for the chosen national survey questions, based on general
topics and categories, is presented below.
■ Eye Health Conditions
► Cataract
► Diabetic Retinopathy
► Glaucoma
► Age Related Macular Degeneration
■ Visual Function
► Blind or severe difficulty seeing
► Difficulty seeing with glasses
► Near-sightedness
► Far-sightedness
► Vision correction
► Vision impairment
■ Service Utilization
► Exam with dilation
► Refractive correction
► Cataract surgery
■ Insurance Coverage and Costs
► Insurance
■ Examination Measures
► Visual acuity

NORC | Survey Analysis Plan: Vision & Eye Health Surveillance System
11
Table 3. Overview of Surveys and TOPICS
Topics
Total
Topics per
Survey
Eye
Conditions
Visual
Function
Service
Utilization
Examination
Measures
Surveys
ACS • 1
BRFSS • • • 3
MCBS • • • 3
NHANES • • • • 4
NHIS • • • 3
NSCH • 1
Total Surveys per Topic 4 6 4 1
NORC | Survey Analysis Plan: Vision & Eye Health Surveillance System
12
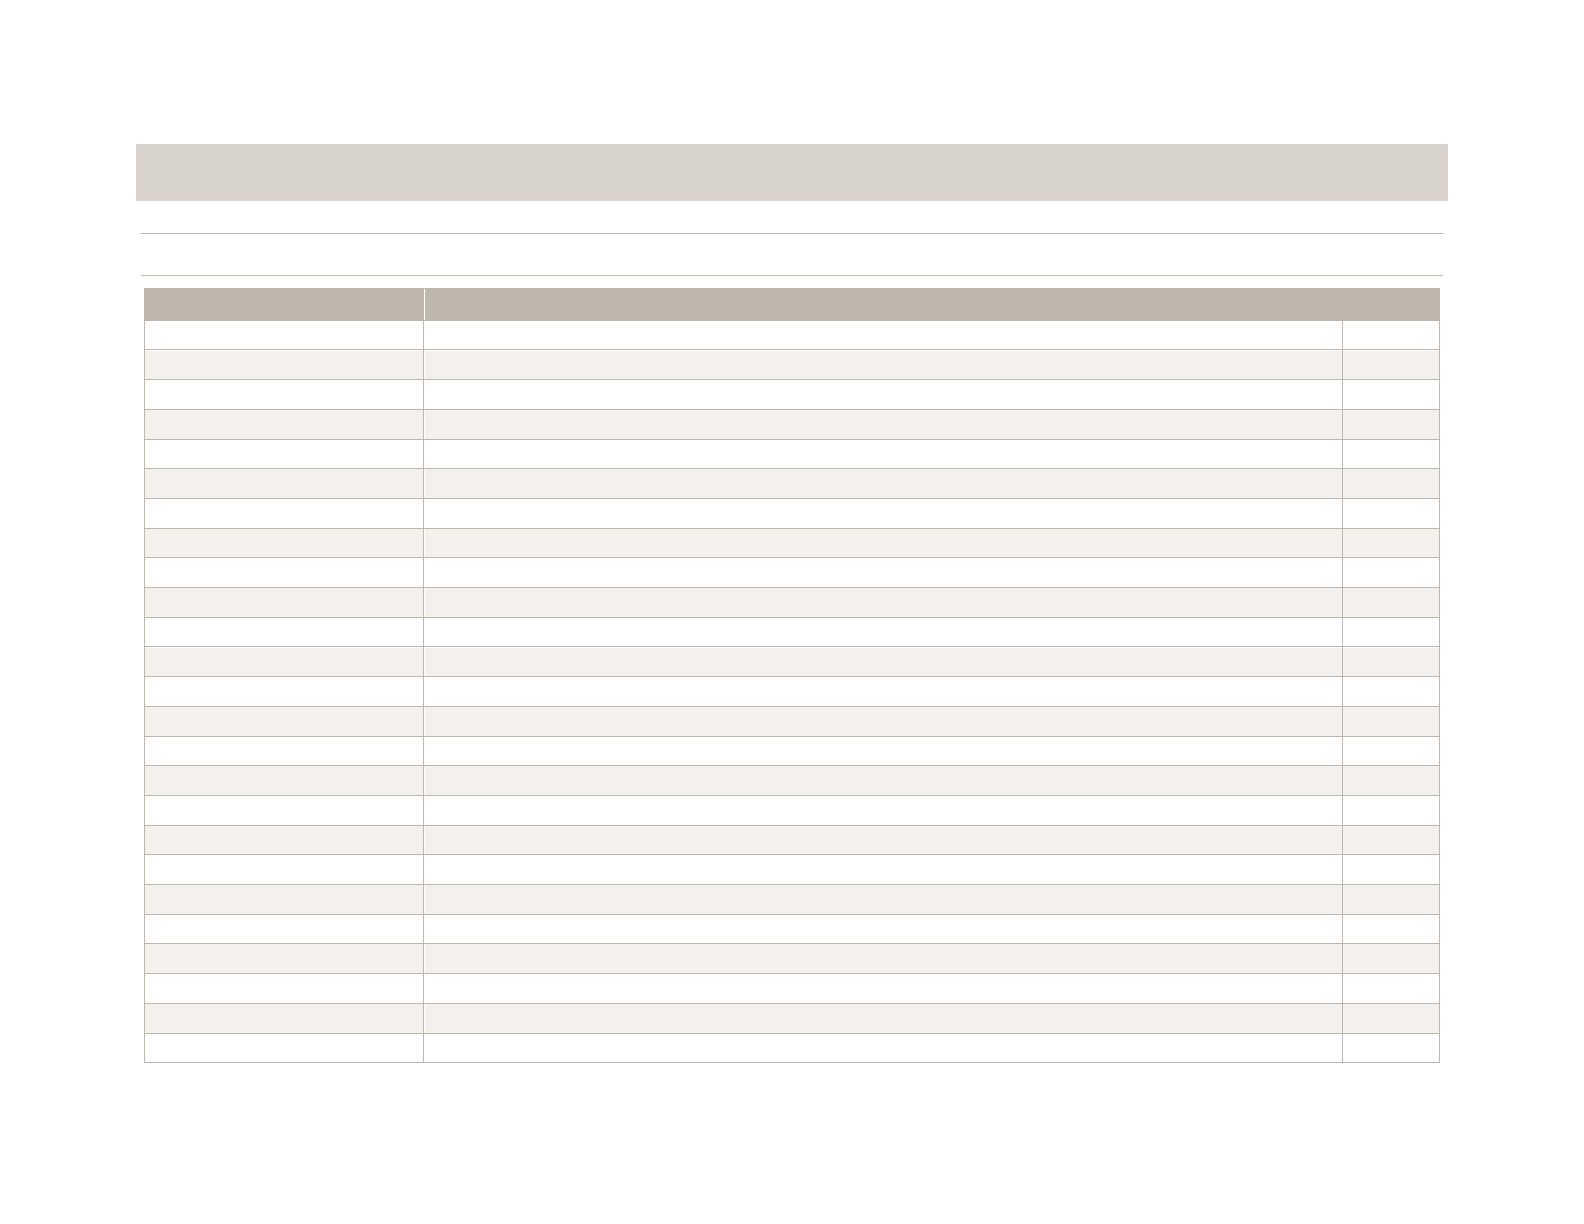
Survey Questions for Analysis
The table below presents the questions chosen for analysis. The ‘Topic’ and ‘Category’ columns show the 2-level categorization described above
for each question. Information presented in the ‘Variable Name’, ‘Years Available’, ‘Question’, and ‘Response Options’ columns was collected
from each survey’s publicly available official documentation. The final column, ‘Response ID’, indicates the name assigned by NORC to each
response option for analysis. Bivariate responses were reported as prevalence rates and coded with ‘yes’ or ‘no’ responses. Other possible
responses such as ‘missing’, ‘don’t know’ or ‘refused’ were not coded in the PUF single-source estimates because these values are not displayed in
the data visualization application, and because in initial testing, such responses were suppressed in all cases.
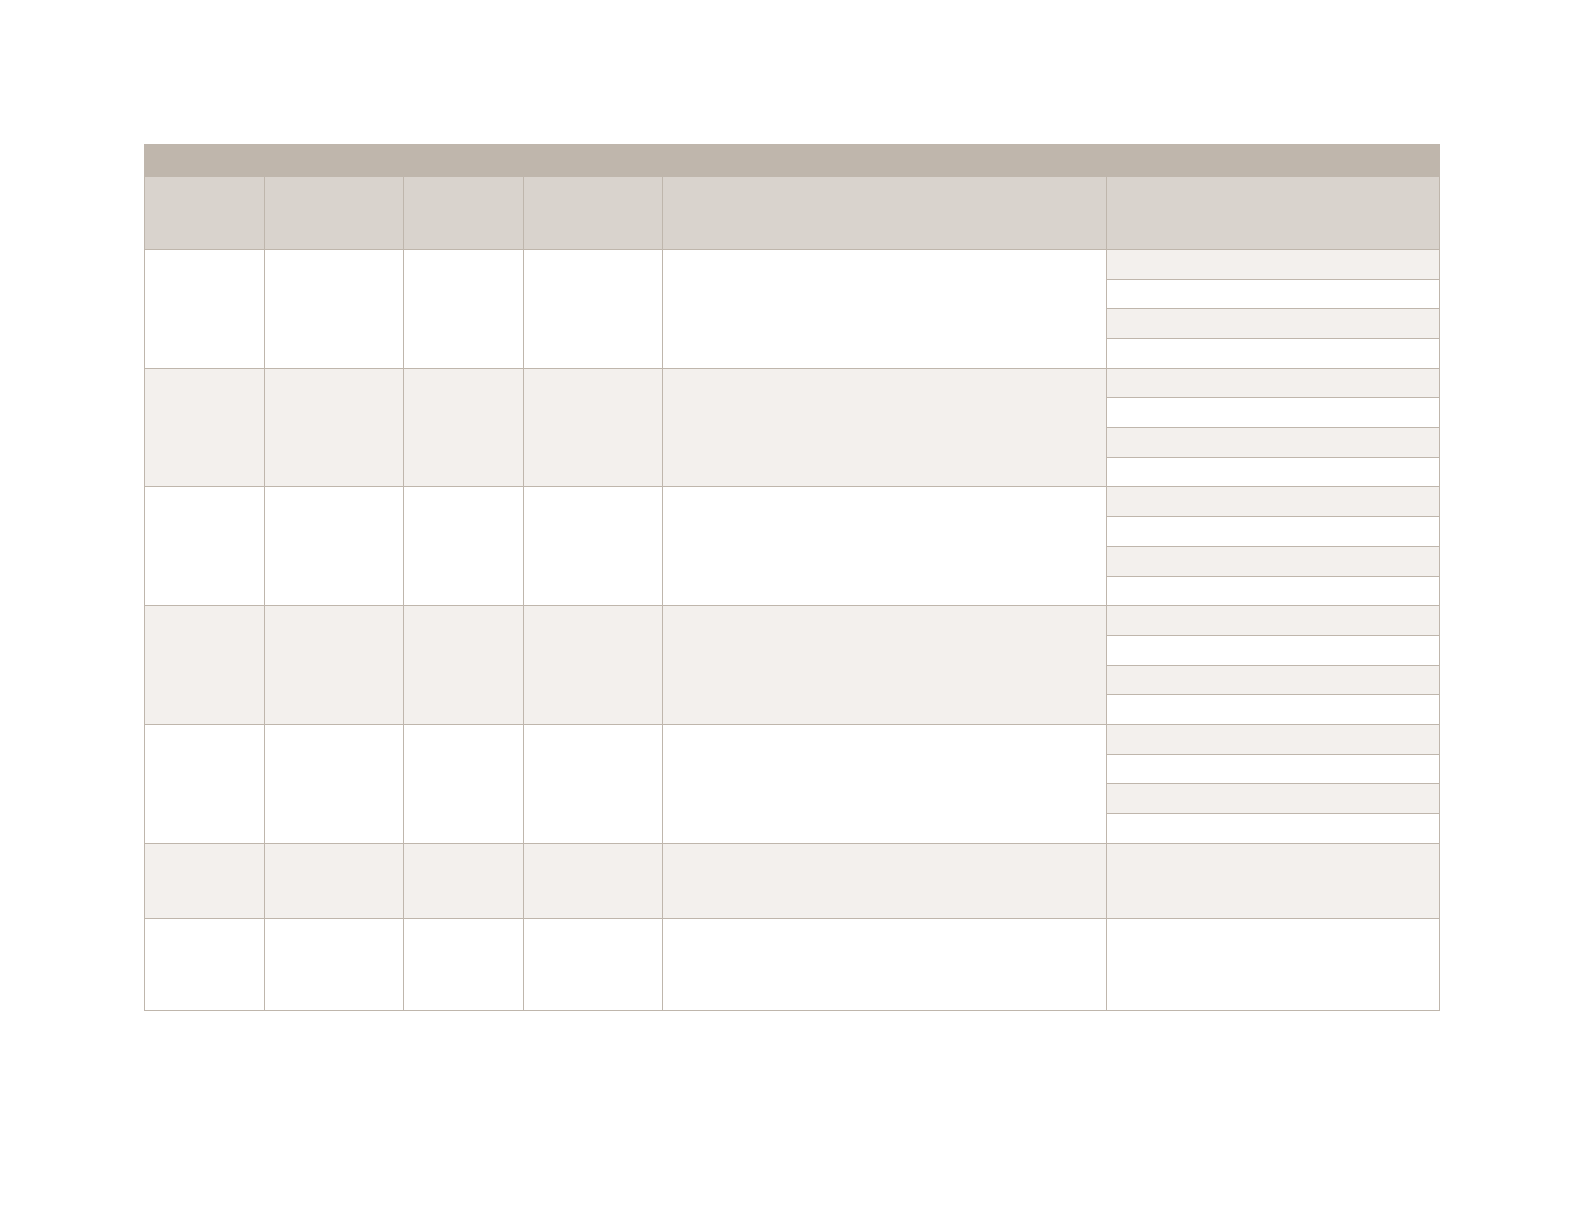
Table 4. Survey questions included in analysis
ACS
Topic Category
Variable
Name
Years
Available
(analyzed) Question Response Options
Visual
Function
Difficulty seeing
with glasses
DIFFEYE 2008-2016
(2014, 2015)
Is this person blind or does he/she have serious
difficulty seeing even when wearing glasses?
1 Yes
2 No
0 Not applicable
BRFSS
Topic Category
Variable
Name
Years
Available
(analyzed) Question Response Options
Demographics Core Section
Visual
Function
Difficulty seeing
with glasses
BLIND 2013-2016
(2016)
Are you blind or do you have serious difficulty seeing,
even when wearing glasses?
1 Yes
2 No
7 Don’t know / Not sure
9 Refused
NORC | Survey Analysis Plan: Vision & Eye Health Surveillance System
13
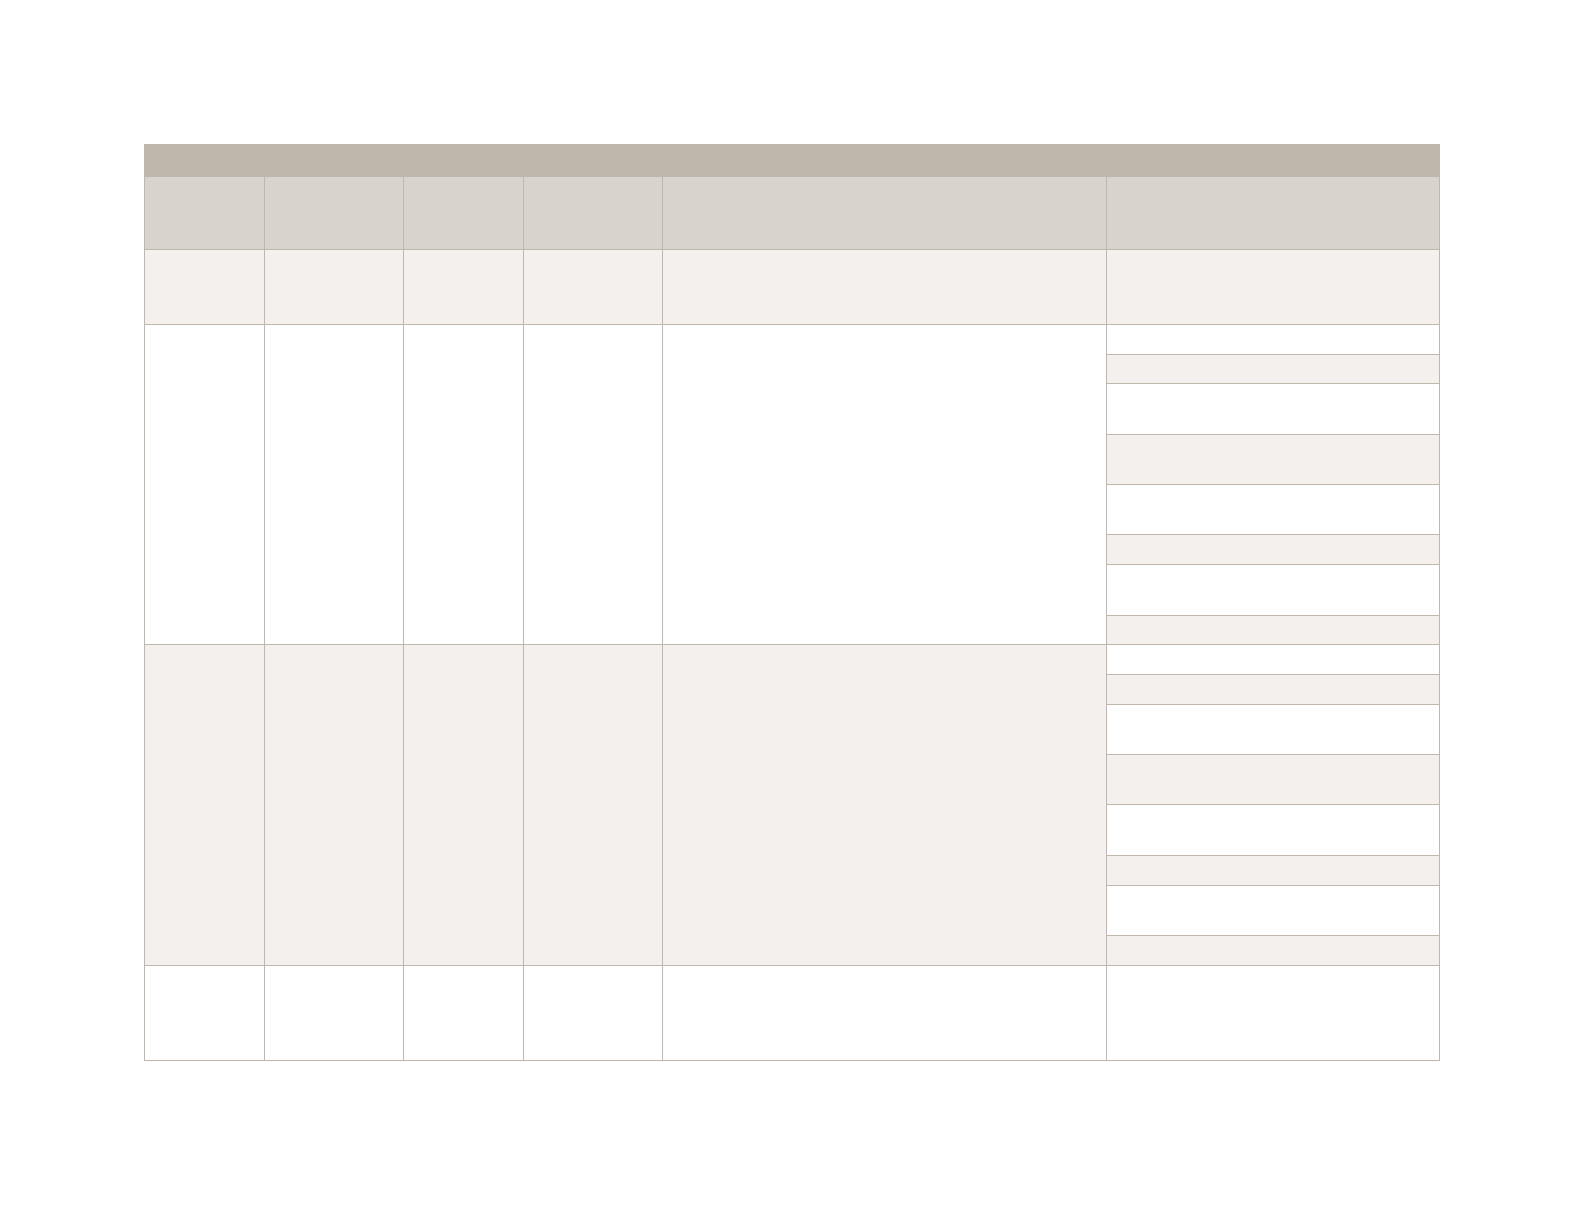
NHANES
Topic Category
Variable
Name
Years
Available
(analyzed) Question Response Options
Service
Utilization
Cataract
Surgery
VIQ070,
VIQ071
1999- 2008
(2005-2008
merged)
{Have you/Has SP} ever had a cataract operation?
1 Yes
2 No
7 Refused
9 Don't know
Visual
Function
Blind or Severe
Difficultly
Seeing
VIQ017 2005-2008
(2005-2008
merged)
{Are you/Is SP} blind in both eyes? 1 Yes
2 No
7 Refused
9 Don't know
Eye Health
Conditions
Self-report
glaucoma
VIQ090 2005-2008
(2005-2008
merged)
{Have you/Has SP} ever been told by an eye doctor
that {you have/s/he has} glaucoma (gla-co-ma),
sometimes called high pressure in {your/his/her} eyes?
1 Yes
2 No
7 Refused
9 Don't know
Eye Health
Conditions
Self-report age
related macular
degeneration
VIQ310 2005-2008
(2005-2008
merged)
{Have you/Has SP} ever been told by an eye doctor
that {you have/s/he has} age-related macular (mac-u-
lar) degeneration?
1 Yes
2 No
7 Refused
9 Don't know
Eye Health
Conditions
Self-report
diabetic
retinopathy
DIQ080 1999-2014
(2005-2008
merged)
Has a doctor ever told {you/SP} that diabetes has
affected {your/his/her} eyes or that {you/s/he} had
retinopathy (ret-in-op-ath-ee)?
1 Yes
2 No
7 Refused
9 Don't know
Eye Health
Conditions
Exam-based
glaucoma
OPXDGLAU,
OPXSGLAU
2005-2008
(2005-2008
merged)
Calculated based on patient’s retinal image in right or
left eye has features suggestive of glaucoma
Yes
Eye Health
Conditions
Exam-based
age related
macular
degeneration
Opduarm,
opdud125,
opduga,
opduexu
2005-2008
(2005-2008
merged)
This field is coded for the presence or absence of any
retinopathy, Left, Right or Worse Eye
Yes
NORC | Survey Analysis Plan: Vision & Eye Health Surveillance System
14
NHANES
Topic Category
Variable
Name
Years
Available
(analyzed) Question Response Options
Eye Health
Conditions
Exam-based
diabetic
retinopathy
diq010, lbxgh,
diq080,
opduret
2005-2008
(2005-2008
merged)
Calculated based among patients with self-report or
exam diagnosed diabetes, and levels of retinopathy
severity, Left, Right or Worse eye.
Yes
Visual Acuity
Measures
Visual acuity
vidrova
vidlova
1999-2008
(2005-2008
merged)
Best-corrected visual acuity Normal vision
Any vision loss (≤20/32 in better eye)
Visual impairment (20/32 - 20/160 in
better eye)
Visual impairment (20/32 - 20/63 in
better eye)
Visual impairment (20/70 - 20/160 in
better eye)
US blind (≤20/200 in better eye)
Monocular vision loss (≤20/70 in either
eye)
Missing acuity
Visual Acuity
Measures
Visual acuity
vidrova
vidlova
vidrova
vidlova
1999-2008
(2005-2008
merged)
Uncorrected Refractive Error (URE) Yes
NORC | Survey Analysis Plan: Vision & Eye Health Surveillance System
15
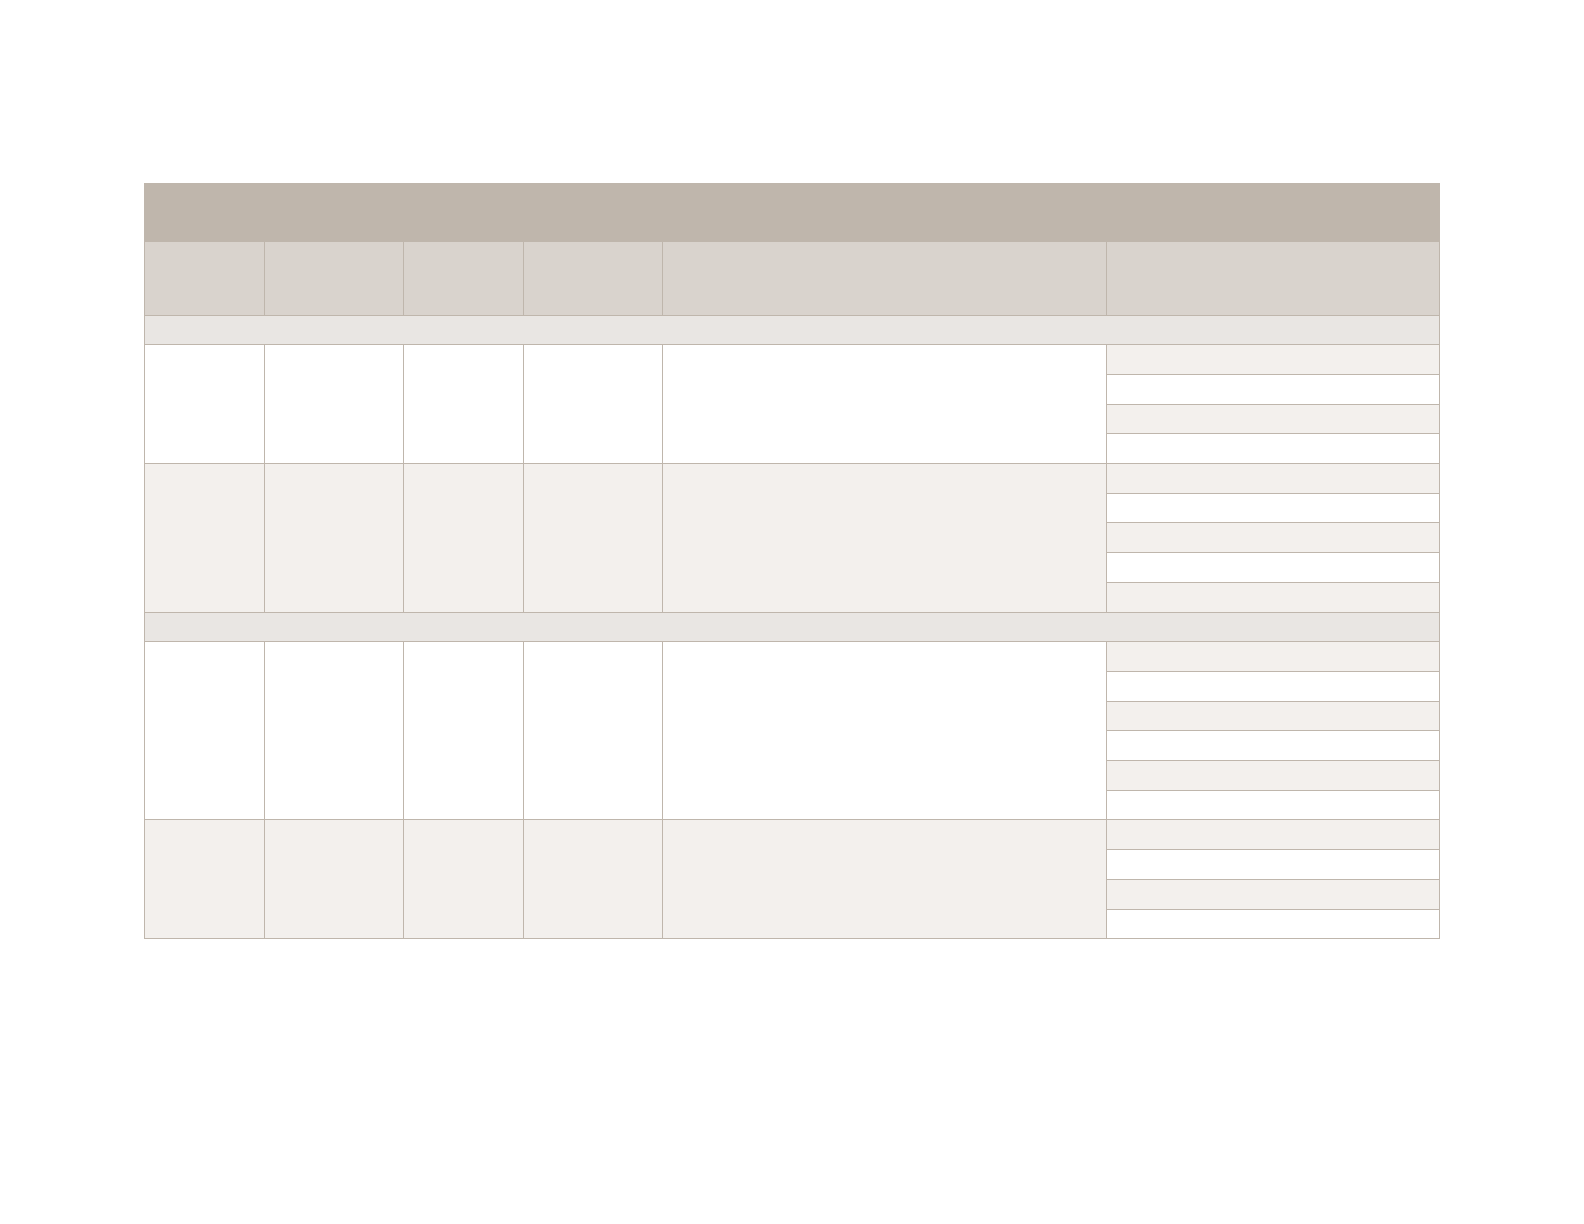
NHIS
(NOTE: Years Available are based on IPUMS database)
Topic Category
Variable
Name
Years
Available
(analyzed) Question Response Options
Adult Questionnaire
Visual
Function
Blind or Severe
Difficulty Seeing
ABLIND
1999-2016
(2014-2015
merged)
Are you blind or unable to see at all?
1 Yes
2 No
7 Refused
9 Don't know
Visual
Function
Difficulty Seeing
with Glasses
AVISION
1999-2016
(2014-2015
merged)
Do you have any trouble seeing, even when wearing
glasses or contact lenses?
1 Yes
2 No
7 Refused
8 Not ascertained
9 Don't know
Functioning and Disability Questionnaire
Visual
Function
Difficulty Seeing
with Glasses
VIS_SS
2011-2016
(2014-2015
merged)
Do you have difficulty seeing, even when wearing
glasses?
1 No difficulty
2 Some difficulty
3 A lot of difficulty
4 Cannot do at all/unable to do
7 Refused
9 Don't know
Visual
Function
Vision
Correction
VIS_0
2012-2016
(2014-2015
merged)
Do you wear glasses? 1 Yes
2 No
7 Refused
9 Don't know
NORC | Survey Analysis Plan: Vision & Eye Health Surveillance System
16
NHIS
(NOTE: Years Available are based on IPUMS database)
Topic Category
Variable
Name
Years
Available
(analyzed) Question Response Options
Child Questionnaire
Visual
Function
Blind or Severe
Difficulty Seeing
CBLIND
1999-2016
(2014-2015
merged)
Is [fill: S.C. name] blind or unable to see at all? 1 Yes
2 No
7 Refused
8 Not ascertained
9 Don't know
Visual
Function
Difficulty Seeing
with Glasses
CVISION
1999-2016
(2014-2015
merged)
Does [fill1: S.C. name] have any trouble seeing [fill2: ,
even when wearing glasses or contact lenses]?
1 Yes
2 No
7 Refused
8 Not ascertained
9 Don't know
NSCH
Topic Category
Variable
Name
Years
Available Question Response Options
Visual
Function
Difficulty Seeing
with Glasses
K2Q44A
2007,
2011/2012
(2007/2011/201
2 merged)
Has a doctor or other health care provider ever told
you that [CHILD] had vision problems that cannot be
corrected with glasses or contact lenses?
1 Yes
2 No
NORC | Survey Analysis Plan: Vision & Eye Health Surveillance System
17
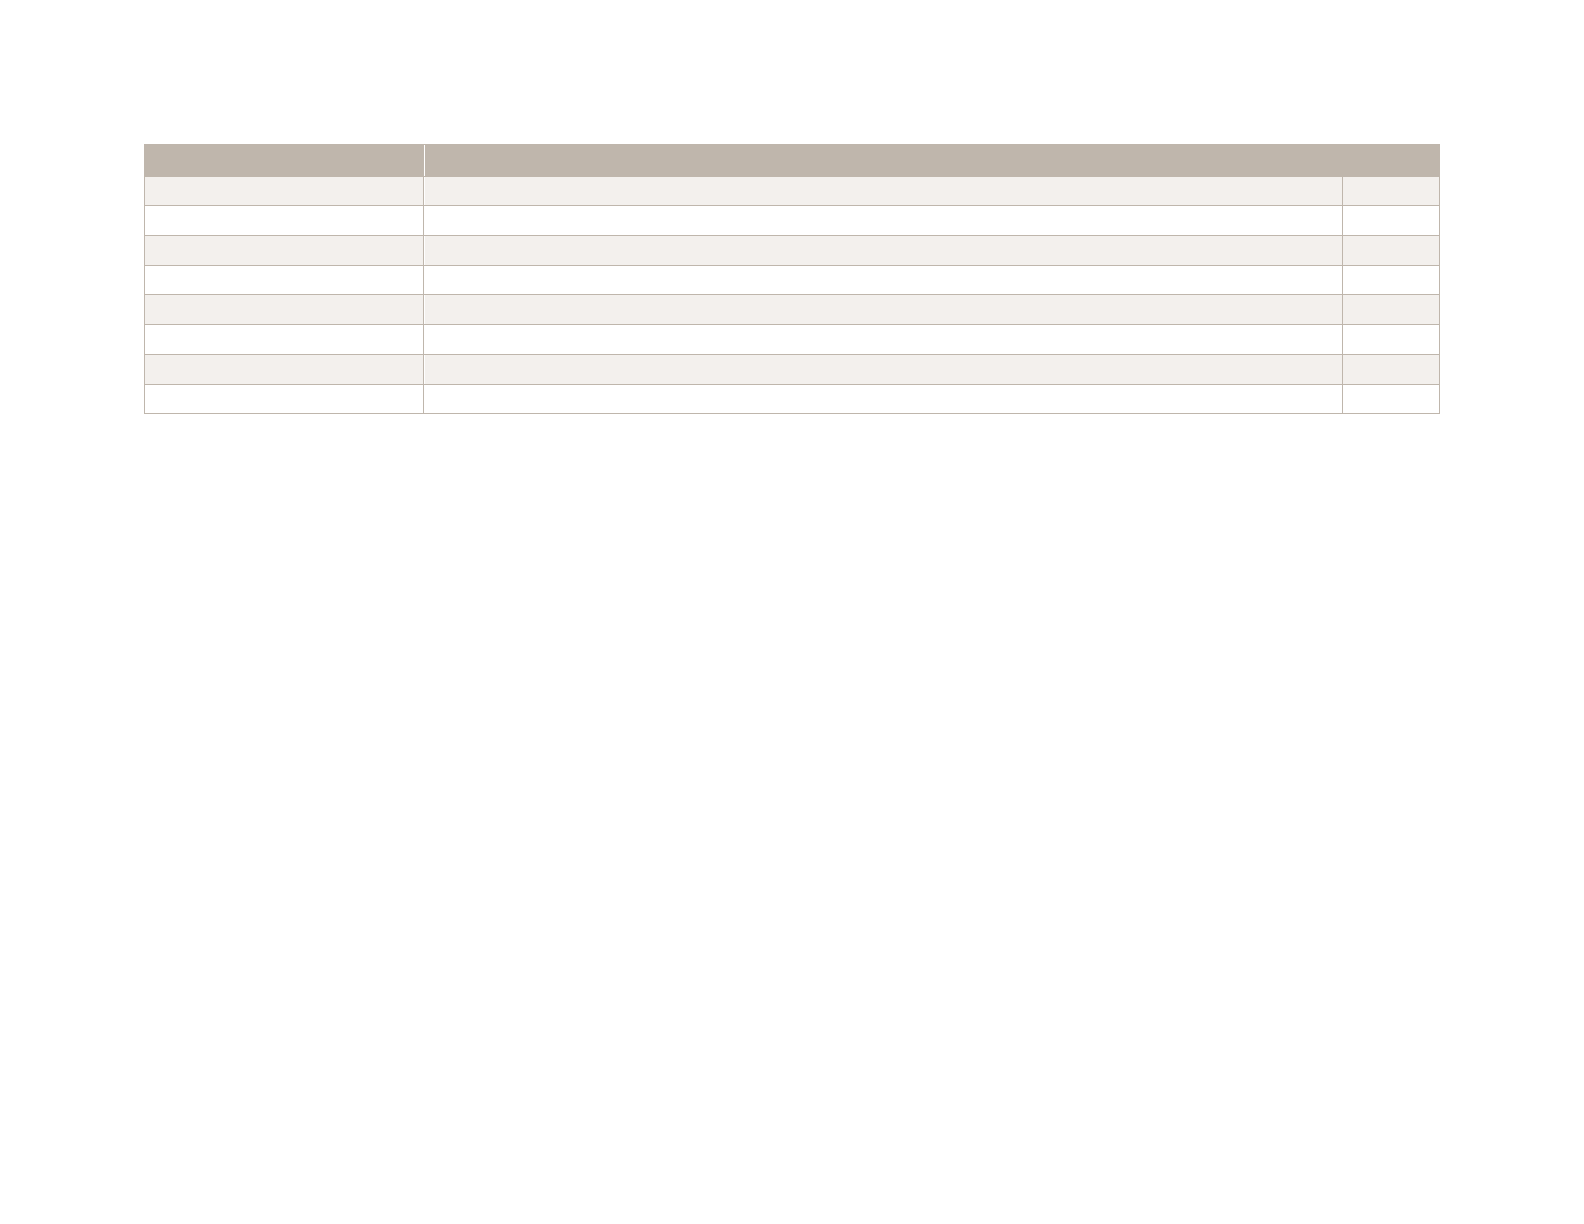
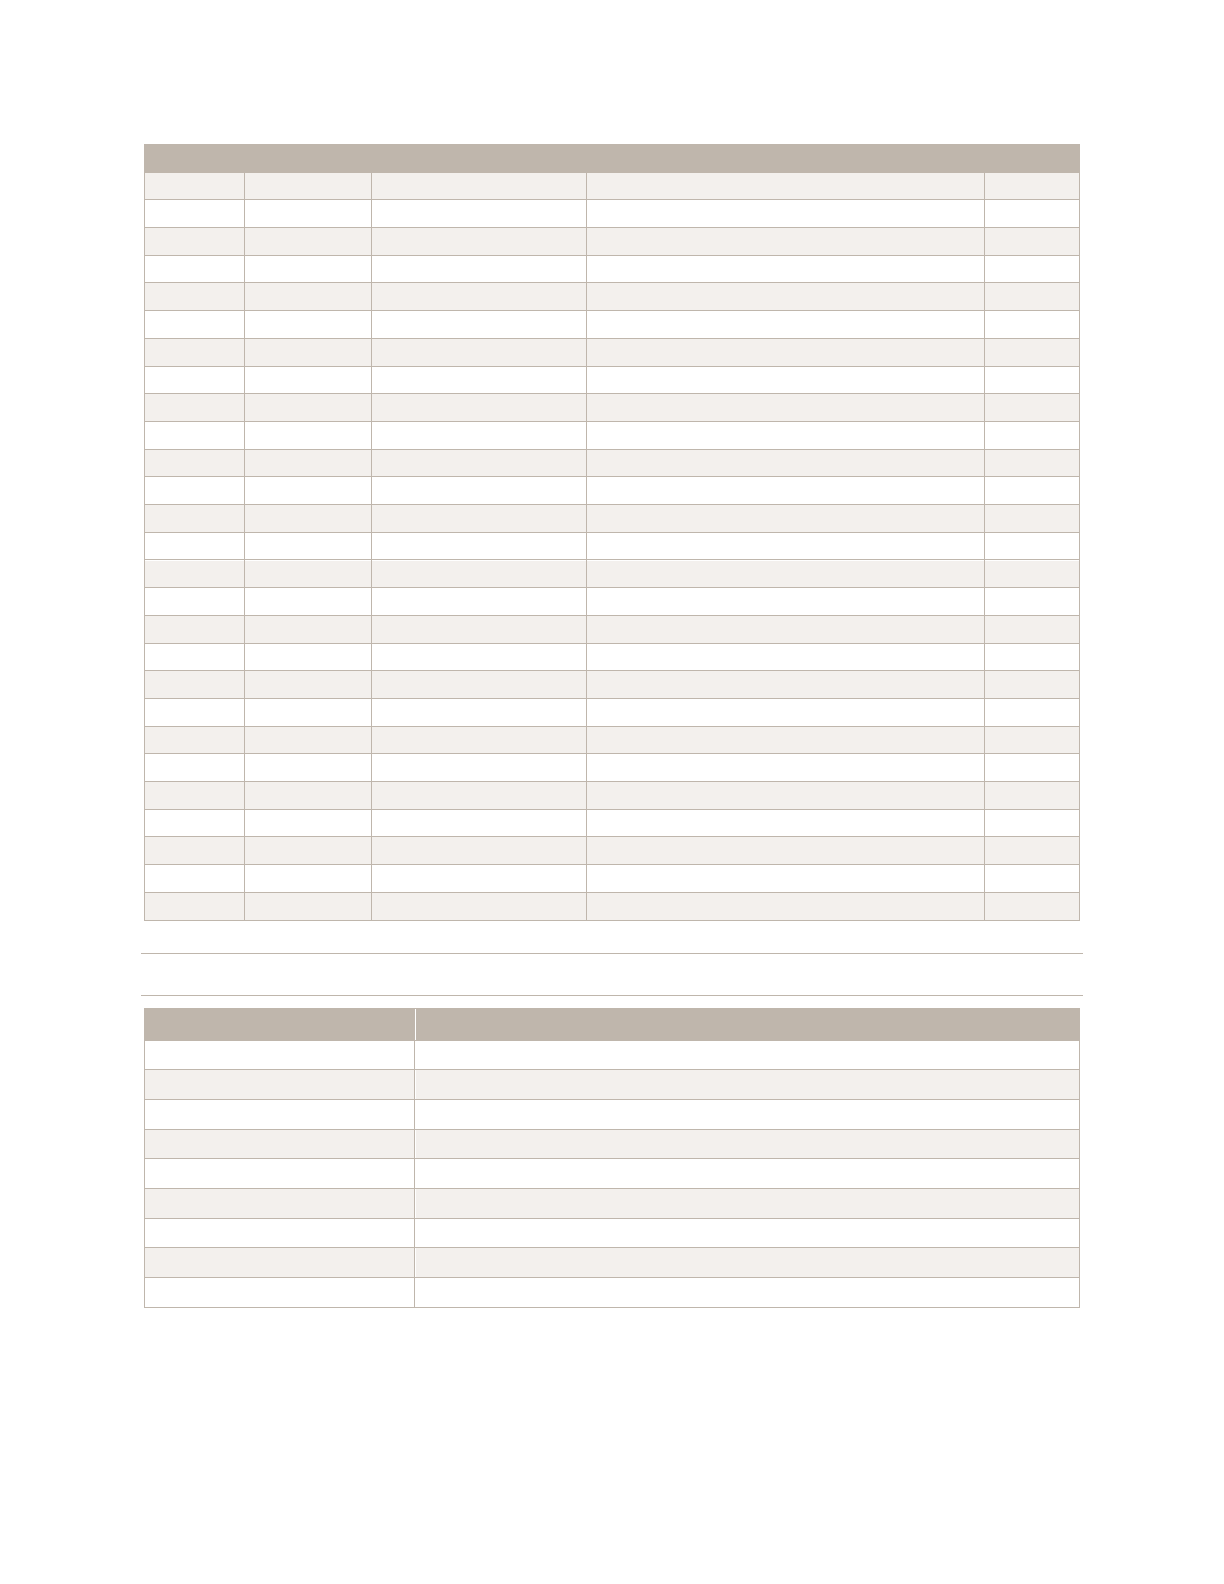
Appendix B. VEHSS Uniform Data Table Template
Table 5. VEHSS Uniform Data Table Template
Source Column Description Data Type
YearStart
Starting Year for year range number
YearEnd
Ending Year for year range, same as starting year if single year used in evaluation. number
LocationAbbr
State Abbreviation plain text
LocationDesc
State Name plain text
DataSource
Abbreviation of Data Source plain text
Topic
Topic description plain text
Category
Category Description plain text
Question
Question Description (i.e., Percentage of adults with diabetic retinopathy) plain text
Response
Optional column to hold the response value that was evaluated. plain text
Age
Stratification value for age group e.g. 18-24yrs plain text
Gender
Stratification value for gender e.g. Male, Female plain text
RaceEthnicity
Stratification value for race e.g. White, non-hispanic plain text
RiskFactor
Stratification value for major risk factor e.g. diabetes plain text
RiskFactorResponse
Optional column to hold response for the risk factor that was evaluated. plain text
Data_Value_Unit
The unit, such as "%" for percentage plain text
Data_Value_Type
The data value type, such as age-adjusted prevalence or crude prevalence plain text
Data_Value
Data Value, such as 14.7 or no value if footnote symbol is present number
Data_Value_Footnote_Symbol
Footnote symbol plain text
Data_Value_Footnote
Footnote text plain text
Low_Confidence_limit
95% confidence interval lower bound number
High_Confidence_Limit
95% confidence interval higher bound number
Sample_Size
Survey sample number
LocationID
Lookup identifier value for Location plain text
GeoLocation
Latitude & Longitude to be provided for formatting GeoLocation or Geocode in the format (latitude, longitude) location
TopicID
Lookup identifier value for Topic plain text
NORC | Survey Analysis Plan: Vision & Eye Health Surveillance System
18
Source Column Description Data Type
CategoryID
Identifier for category plain text
QuestionID
Lookup identifier value for Question plain text
ResponseID
Response identifier for Question Plain text
AgeID
Identifier for the stratification1 (Age) plain text
GenderID
Identifier for the stratification2 (Sex) plain text
RaceEthnicityID
Identifier for the stratification3 (Race/Ethnicity) plain text
RiskFactorID
Identifier for the stratification4 (Major Risk Factor) plain text
RiskFactorResponseID
Response identifier for Major Risk Factor Response plain text
NORC | Survey Analysis Plan: Vision & Eye Health Surveillance System
19
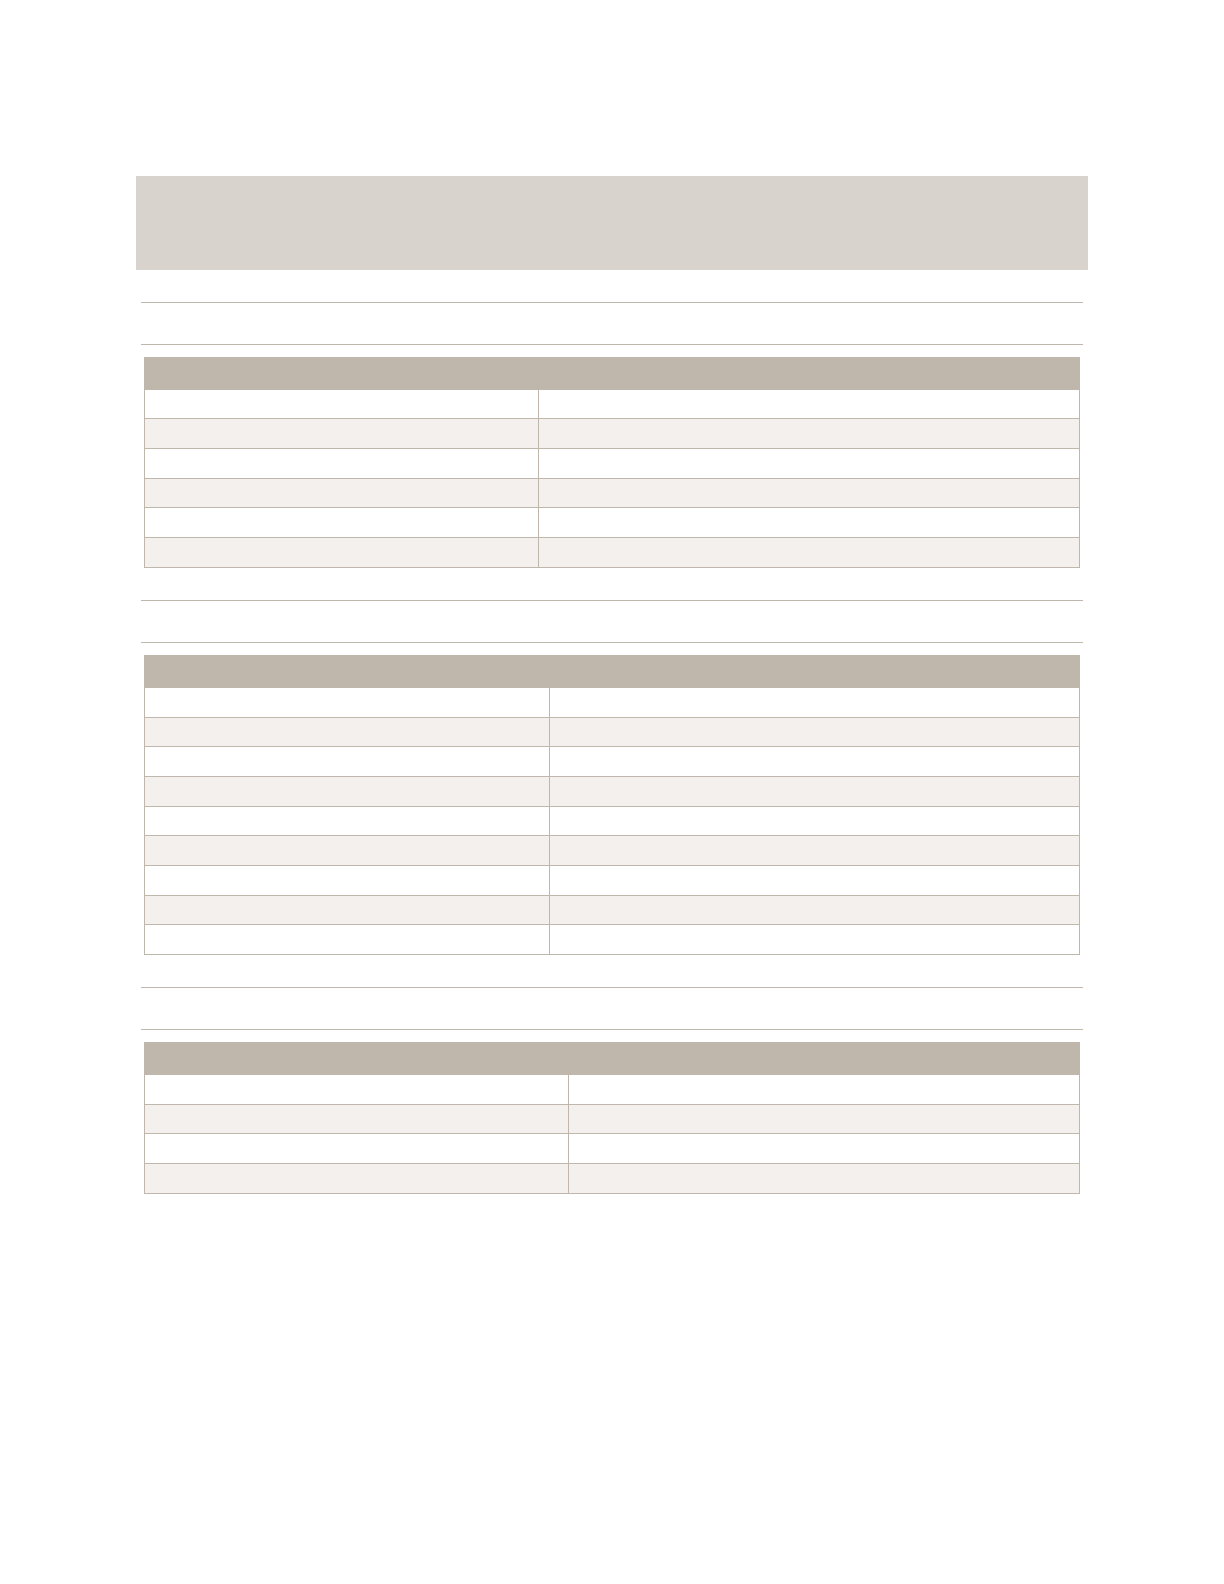
Appendix C. VEHSS Uniform Data Template: Survey
Stratification Factors Data Dictionary
Table 6. PUF Ages
AgeID Age
AGEALL
All Ages
AGE017
0-17 years
AGE1839
18-39 years
AGE4064
40-64 years
AGE6584
65-84 years
AGE85PLUS
85 years and older
Table 7. Race/Ethnicity Categories
RaceEthnicityID RaceEthnicity
ALLRACE
All races
ASN
Asian
BLK
Black, non-Hispanic
HISP
Hispanic, any race
NONE
None given or missing
AIAN
North American Native
OTH
Other
WHT
White, non-Hispanic
UNK
Unknown
Table 8. Gender Categories
GenderID Description
GM
Male
GF
Female
GALL
Total
GU
Unknown
NORC | Survey Analysis Plan: Vision & Eye Health Surveillance System
20
Table 9. Risk Factors
RiskFactorID RiskFactor
RFALLPAR All patients
All participants (survey)
RFDM
Diabetes
RFHT
Hypertension
RFSM
Smoking
RFNR
No Risk Factors
Table 10. Locations
LocationId LocationAbbr LocationDesc GeoLocation StateType
59
US National (States and DC) National
01
AL Alabama (32.84057112200048, -86.63186076199969) State
02
AK Alaska (64.84507995700051, -147.72205903599973) State
04
AZ Arizona (34.865970280000454, -111.76381127699972) State
05
AR Arkansas (34.74865012400045, -92.27449074299966) State
06
CA California (37.63864012300047, -120.99999953799971) State
08
CO Colorado (38.843840757000464, -106.13361092099967) State
09
CT Connecticut (41.56266102000046, -72.64984095199964) State
10
DE Delaware (39.008830667000495, -75.57774116799965) State
12
FL Florida (28.932040377000476, -81.92896053899966) State
13
GA Georgia (32.83968109300048, -83.62758034599966) State
16
ID Idaho (43.682630005000476, -114.3637300419997) State
17
IL Illinois (40.48501028300046, -88.99771017799969) State
18
IN Indiana (39.766910452000445, -86.14996019399968) State
19
IA Iowa (42.46940091300047, -93.81649055599968) State
20
KS Kansas (38.34774030000045, -98.20078122699965) State
31
NE Nebraska (41.6410409880005, -99.36572062299967) State
40
OK Oklahoma (35.47203135600046, -97.52107021399968) State
44
RI Rhode Island (41.70828019300046, -71.52247031399963) State
47
TN Tennessee (35.68094058000048, -85.77449091399967) State
15
HI Hawaii (21.304850435000446, -157.85774940299973) State
22
LA Louisiana (31.31266064400046, -92.44568007099969) State
23
ME Maine (45.254228894000505, -68.98503133599962) State
24
MD Maryland (39.29058096400047, -76.60926011099963) State
25
MA Massachusetts (42.27687047000046, -72.08269067499964) State
26
MI Michigan (44.6613195430005, -84.71439026999968) State
27
MN Minnesota (46.35564873600049, -94.79420050299967) State
28
MS Mississippi (32.745510099000455, -89.53803082499968) State
29
MO Missouri (38.635790776000476, -92.56630005299968) State
30
MT Montana (47.06652897200047, -109.42442064499971) State
32
NV Nevada (39.493240390000494, -117.07184056399967) State
33
NH New Hampshire (43.65595011300047, -71.50036091999965) State
34
NJ New Jersey (40.13057004800049, -74.27369128799967) State
NORC | Survey Analysis Plan: Vision & Eye Health Surveillance System
21
LocationId LocationAbbr LocationDesc GeoLocation StateType
35
NM New Mexico (34.52088095200048, -106.24058098499967) State
36
NY New York (42.82700103200045, -75.54397042699964) State
37
NC North Carolina (35.466220975000454, -79.15925046299964) State
38
ND North Dakota (47.47531977900047, -100.11842104899966) State
39
OH Ohio (40.06021014100048, -82.40426005599966) State
41
OR Oregon (44.56744942400047, -120.15503132599969) State
42
PA Pennsylvania (40.79373015200048, -77.86070029399963) State
45
SC South Carolina (33.998821303000454, -81.04537120699968) State
46
SD South Dakota (44.353130053000484, -100.3735306369997) State
48
TX Texas (31.827240407000488, -99.42677020599967) State
49
UT Utah (39.360700171000474, -111.58713063499971) State
50
VT Vermont (43.62538123900049, -72.51764079099962) State
51
VA Virginia (37.54268067400045, -78.45789046299967) State
53
WA Washington (47.52227862900048, -120.47001078999972) State
54
WV West Virginia (38.66551020200046, -80.71264013499967) State
55
WI Wisconsin (44.39319117400049, -89.81637074199966) State
56
WY Wyoming (43.23554134300048, -108.10983035299967) State
11
DC District of Columbia (38.89037138500049, -77.03196112699965) State
21
KY Kentucky (37.645970271000465, -84.77497104799966) State
72
PR Puerto Rico (18.2208330,-66.5901490) Territory
66
GU Guam (13.4443040,144.7937310) Territory
78
VI U.S. Virgin Islands (18.3357650,-64.8963350) Territory
69
MP Northern Mariana Islands (15.097900,145.673900) Territory
68
MH Marshall Islands (11.3246908,166.84174239999993) Territory
70
PW Palau (7.514979999999999,134.58251999999993) Territory
60
AS American Samoa (-14.3016396,-170.69618149999997) Territory
0
XX Missing location
Table 11. Insurance (RDF only)
InsuranceID Insurance
Ins_D
Medicare+Medicaid Dual Eligible
Ins_E
Medicaid
Ins_S
Medicare Fee For Service
Ins_C
Medicare Managed
Ins_Y
Military
Ins_G
Other Gov
Ins_P
Private
Ins_U
No Payment Listed
Ins_All
All payers

NORC | Survey Analysis Plan: Vision & Eye Health Surveillance System
22
Appendix D. Default Prevalence Estimates Stratifications for
Survey Data
By national and by state:
1–way
1. Age
2. Race
3. Gender
4. RiskFactor
2-way
5. Age*Race
6. Age*Gender
7. Age*RiskFactor
8. Race*Gender
9. Race*RiskFactor
10. Gender*RiskFactor
3-way
11. Age*Race*Gender
12. Age*Race*RiskFactor
13. Age*Gender*RiskFactor
14. Race*Gender*RiskFactor
4-way
15. Age*Race*Gender*RiskFactor
